Project GO
Water: Too Much, Too Little
Standards
Background Information
Content Enhancement Video
Background Information
Anyone who lives in the state of Texas is aware of the dichotomous weather and climate pattern that dictates day to day life, settlement patterns, economic activities, and rural and urban development. There is no better example of the geographic theme of human-environmental interactions than this. Those who live in Southeast Texas around Houston and the Gulf of Mexico coast are prepared for hurricanes, storm surges and flooding; Central Texas from Waco to San Antonio is widely known as “Flash Flood Alley” but also suffers from yearly droughts; and those who live in West Texas from El Paso to Midland then north to Lubbock and Amarillo are prepared for tornadoes and sustained droughts each year. Essentially, the weather of Texas can be polarized by either too much water or too little water and depending on which area you live in can determine how it impacts your life.
Precipitation in Texas
On average, the state of Texas experiences annual rainfall at about 27 inches (however rainfall totals vary across the different climate regions of Texas (WeatherSTEM 20171). We suggest you visit the National Centers for Environmental Information website, to view up-to-date and past maps on the climate. These can be viewed at different scales, including global, national, regional, statewide, divisional, county, and city. The data can also be shown for different variables, such as precipitation, average temperature, Palmer Drought Severity Index, etc.
The first three figures show Total Precipitation on the county scale for three different time periods:
- August 2019 – September 2020
- April 2020 – March 2021, and
- March 2021
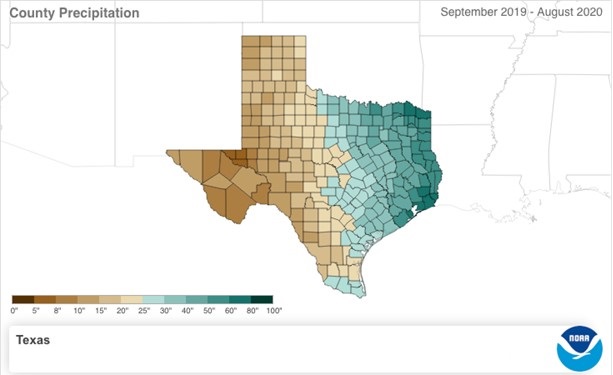
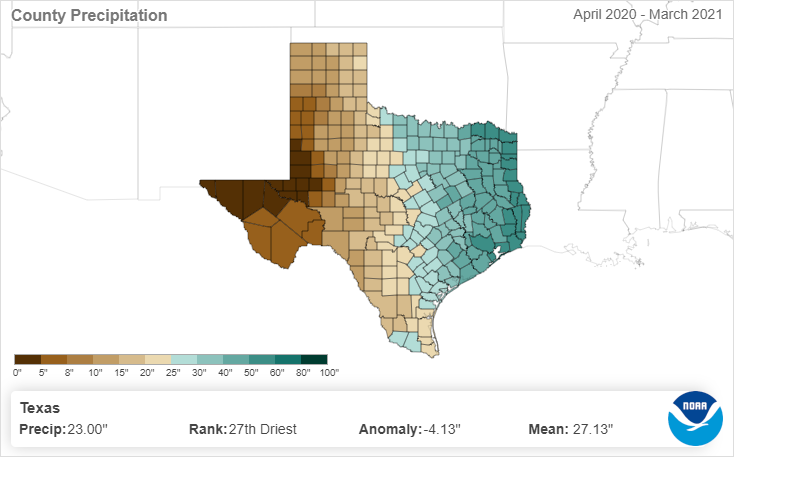
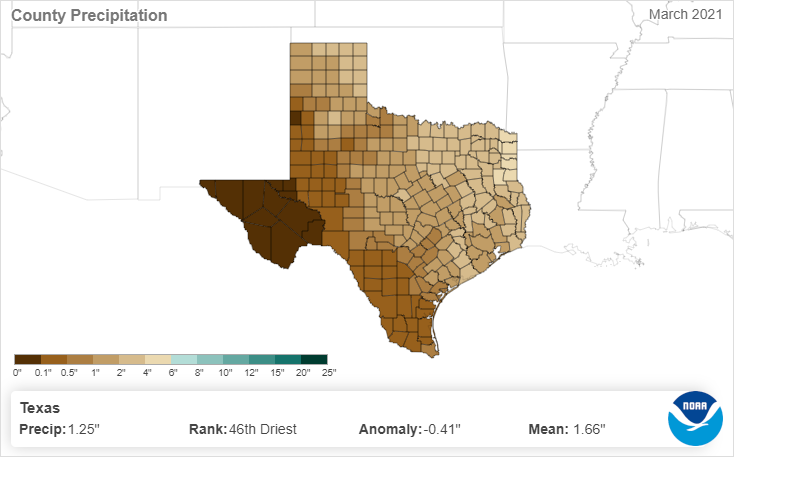
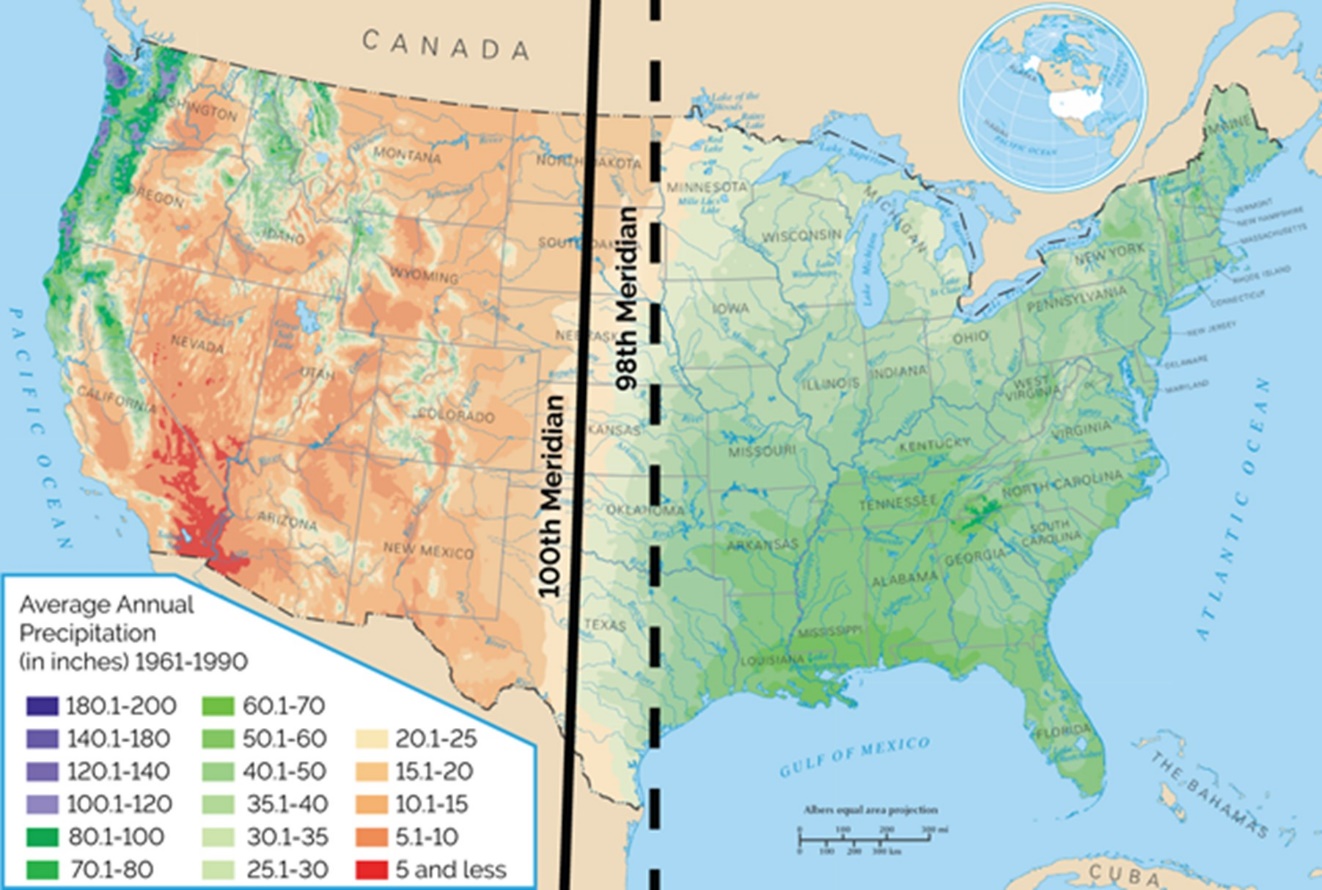
A distinct pattern begins to form when looking at these maps. It aligns with the 100th Meridian, which roughly cuts midway through the Great Plains, and continues to serve as a climate boundary along which approximately 20 inches of precipitation occur annually. In Texas, the meridian begins at the eastern boundary of the Panhandle and continues southward (Howder, 20132), dividing the state into two distinct climate areas. East and southeast of this boundary, the state receives “too much” rainfall, and experiences a humid tropical and subtropical climate, respectively, while west of the meridian, Texas becomes semi-arid and dry from “too little” precipitation.
Climate Regions of Texas
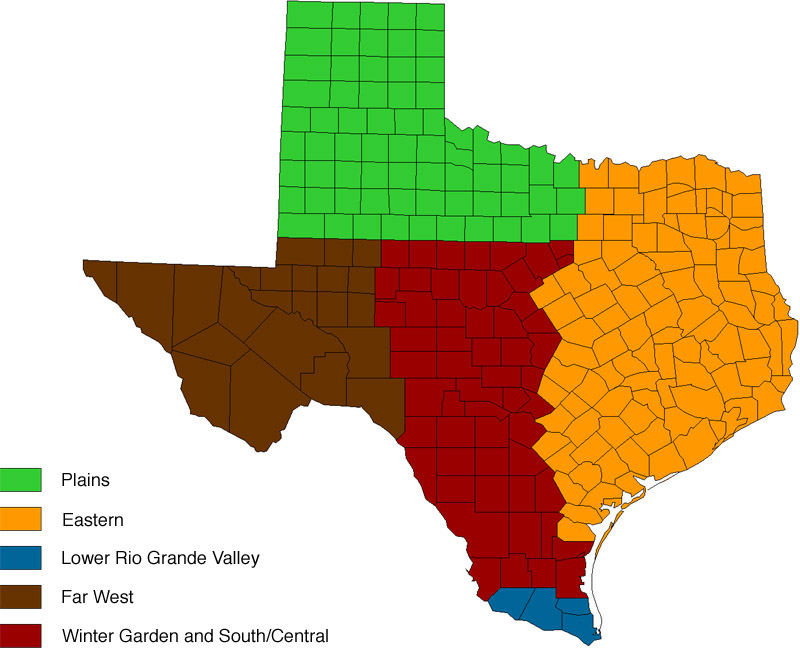
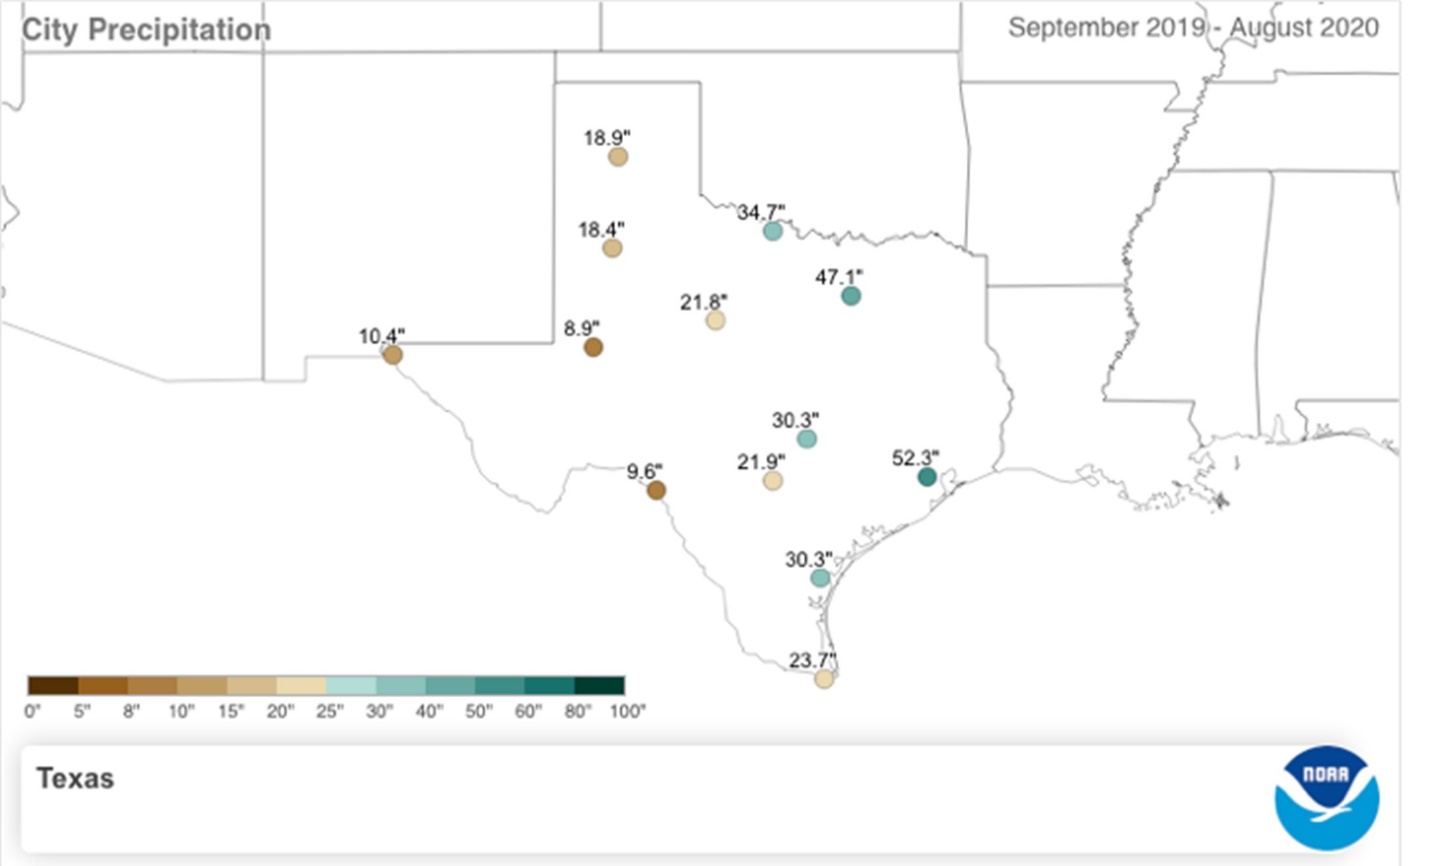
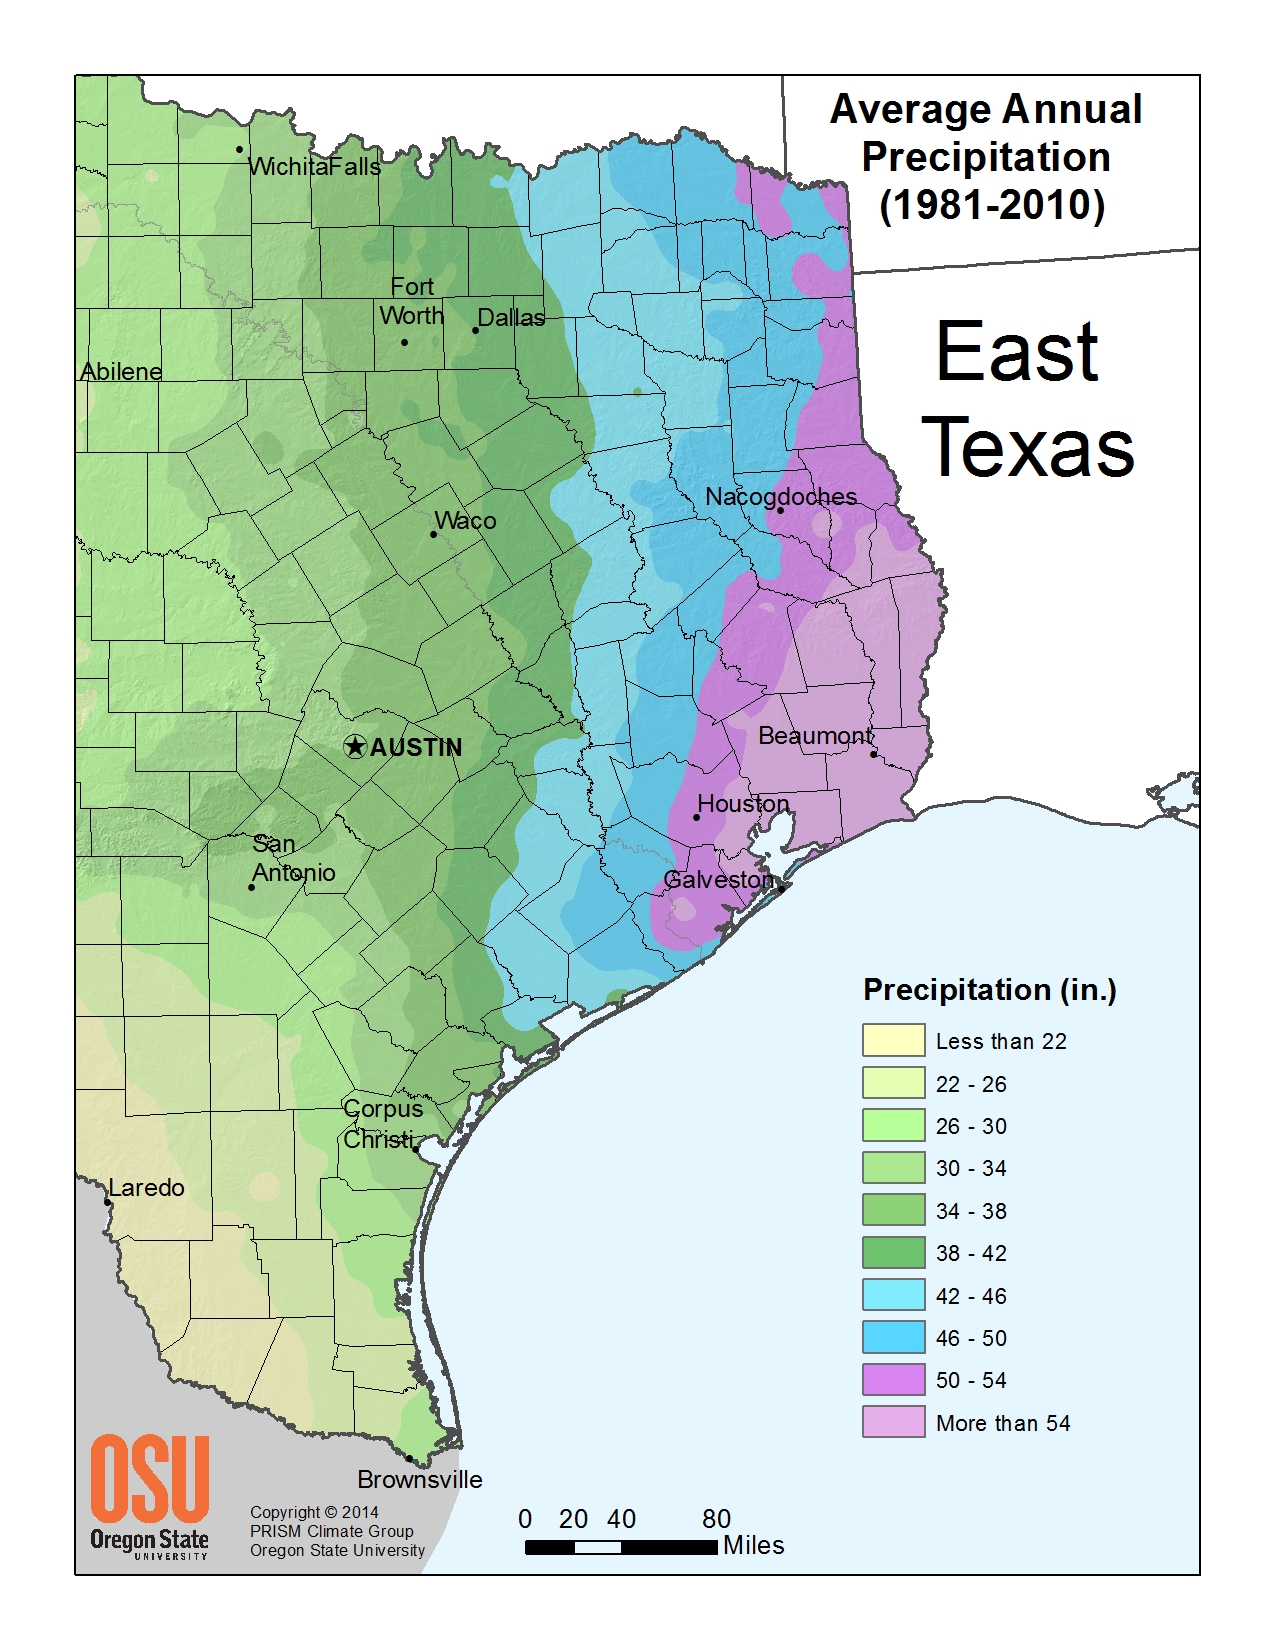
The first map outlines the different climate regions within the state of Texas. The second map shows the amount of rainfall in major cities across the state of Texas from the time of September 2019-August 2020. This map can be used in comparison with the following two maps that show average annual precipitation (1981 – 2010) for West and East Texas.
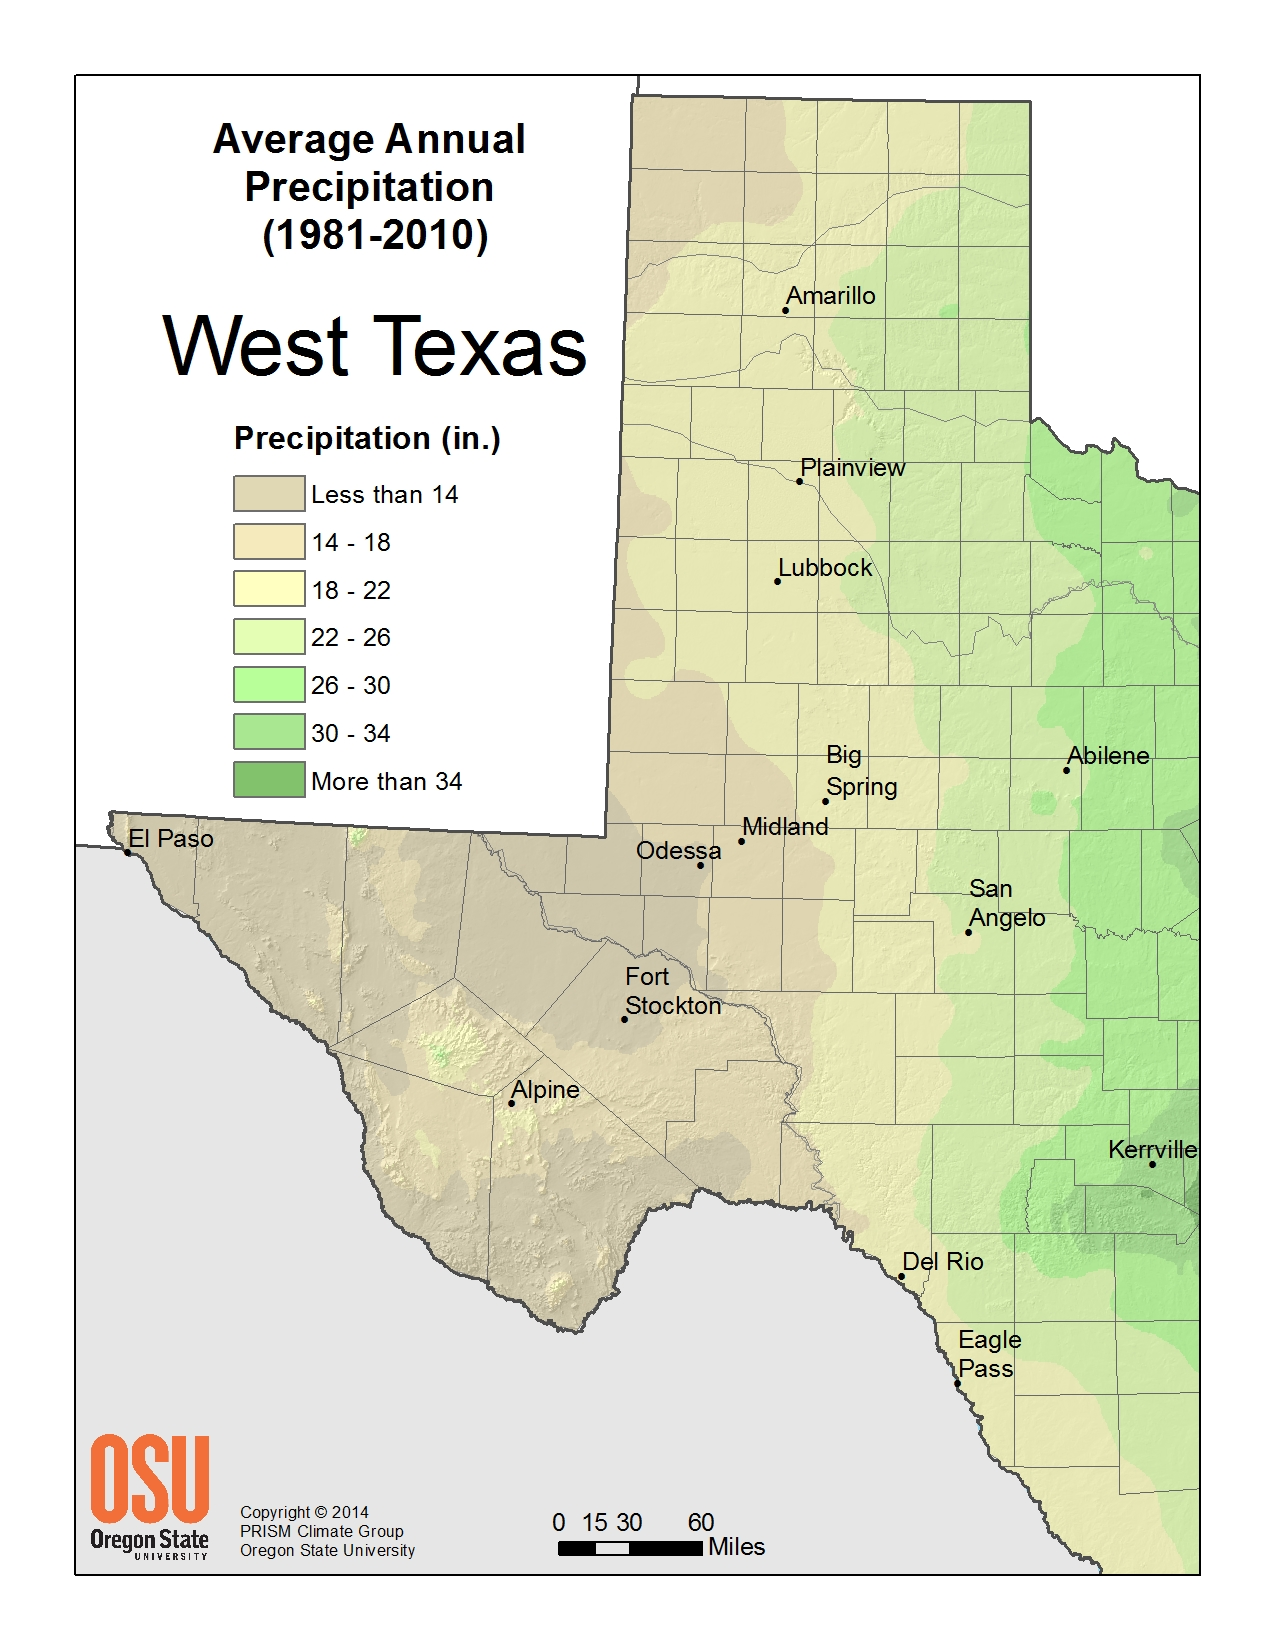
West Texas
West of the “invisible” 100th meridian boundary between the humid and arid parts of the state irrigation is necessary to grow crops requiring surface water storage in reservoirs, and/or drawn from underground reservoirs (Leifert, 20183). In addition, too little water dictates the types of crops that can be sustained in arid west Texas. Many large cities in west Texas, such as Amarillo, Plainview, Lubbock, Big Spring and Del Rio receive low rainfall amounts between 14-18 inches, while cities further west, such as Odessa, Fort Stockton, and Del Rio receive 14 inches or less. Natural hazards that predominate west of the 100th Meridian include drought, blizzards, and tornadoes.
The Plains region including the northern Panhandle (Amarillo, north to Oklahoma) and South Plains (Lubbock, south to Big Spring) requires vast dryland and center pivot irrigation production. The primary source of water is from the Ogallala Aquifer. The region has clayey soils to the north and generally sandy soils to south and east. The Plains includes areas eastward of the Rolling Plains along the Red River to I-35 and south to I-20 and Abilene, with dryland production and with some pockets of irrigation. The region varies from 2,000 to 4,600 feet elevation; 26 inches of rain on the east to 16 inches on west at the NM border and growing seasons from 160 to 240 days. Crops that predominate in this region include, grains, cotton, and oil seed crops with major acreages of horticultural crops (Texas A&M AgriLife Extension4).
Far West Texas includes Trans Pecos region (Del Rio, north on US 277) and west to El Paso, with arid lands in the upper Chihuahuan Desert and Desert Grasslands. Rainfall is sparse at 10 inches or less per annum, but crop production is intensive where irrigation water is available from the Rio Grande and Pecos Rivers. Crops include cotton, grains, and intensive vegetable and other horticultural crops on alluvial soils in a high desert environment. Production systems are similar to those in New Mexico and Arizona (Texas A&M AgriLife Extension).
East Texas
Except for far west Texas, the state has two pronounced rainy seasons in the Spring and Fall. Both are impacted by polar fronts interacting with moist air from the Gulf of Mexico during those seasons, in particular, Fall seasons experience hurricanes and tropical depressions inundating the coastal areas with storm surge and flooding. Average annual rainfall amounts from several large cities west of the 100th Meridian illustrate this point—Dallas (37.57 inches), Houston (54.65 inches), and Brownsville (27.44 inches) (WeatherSTEM 2017). In addition to hurricanes, tropical systems, and flooding, other hazards east of the meridian include winter weather events, thunderstorms, tornadoes, and interior flash flooding.
The Eastern Areas include East Texas which is typified by sandy soils, small farms and family operations with intensive crop production and numerous cow-calf/pasture operations. Bordered by I-35 on west and Oklahoma and Louisiana north and east, the region also extends southward to Beaumont and Upper Gulf Coast, south to Houston, Corpus Christi, and Coastal Bend region. East Texas experiences good seasonal rains, however, irrigation is common. The region has humid summers, a long growing season, and has close proximity to rural roadside and major metro markets (Texas A&M AgriLife Extension).
The Winter Garden and South/Central region includes the Winter Garden and Uvalde area, an intensive irrigated region west and south of San Antonio and the Hill Country. This region extends northward to Abilene and southward to the Lower Rio Grande Valley. It is characterized by diversified dryland and irrigated crop production (from the Edwards Aquifer) inter-dispersed in the vast rangeland and beef production areas (Texas A&M AgriLife Extension).
The Lower Rio Grande Valley is the major vegetable region in the state and includes the four southern-most counties. The area is characterized bu alluvial soils along the Rio Grande River and a subtropical environment with 340 frost-free days. Irrigation water is obtained from canals or wells along the river. A wide diversity of crops abounds for fresh and processing markets, including citrus and early season vegetables for early market windows and agronomic crops of cotton, grains, sugarcane, and other crops (Texas A&M AgriLife Extension).
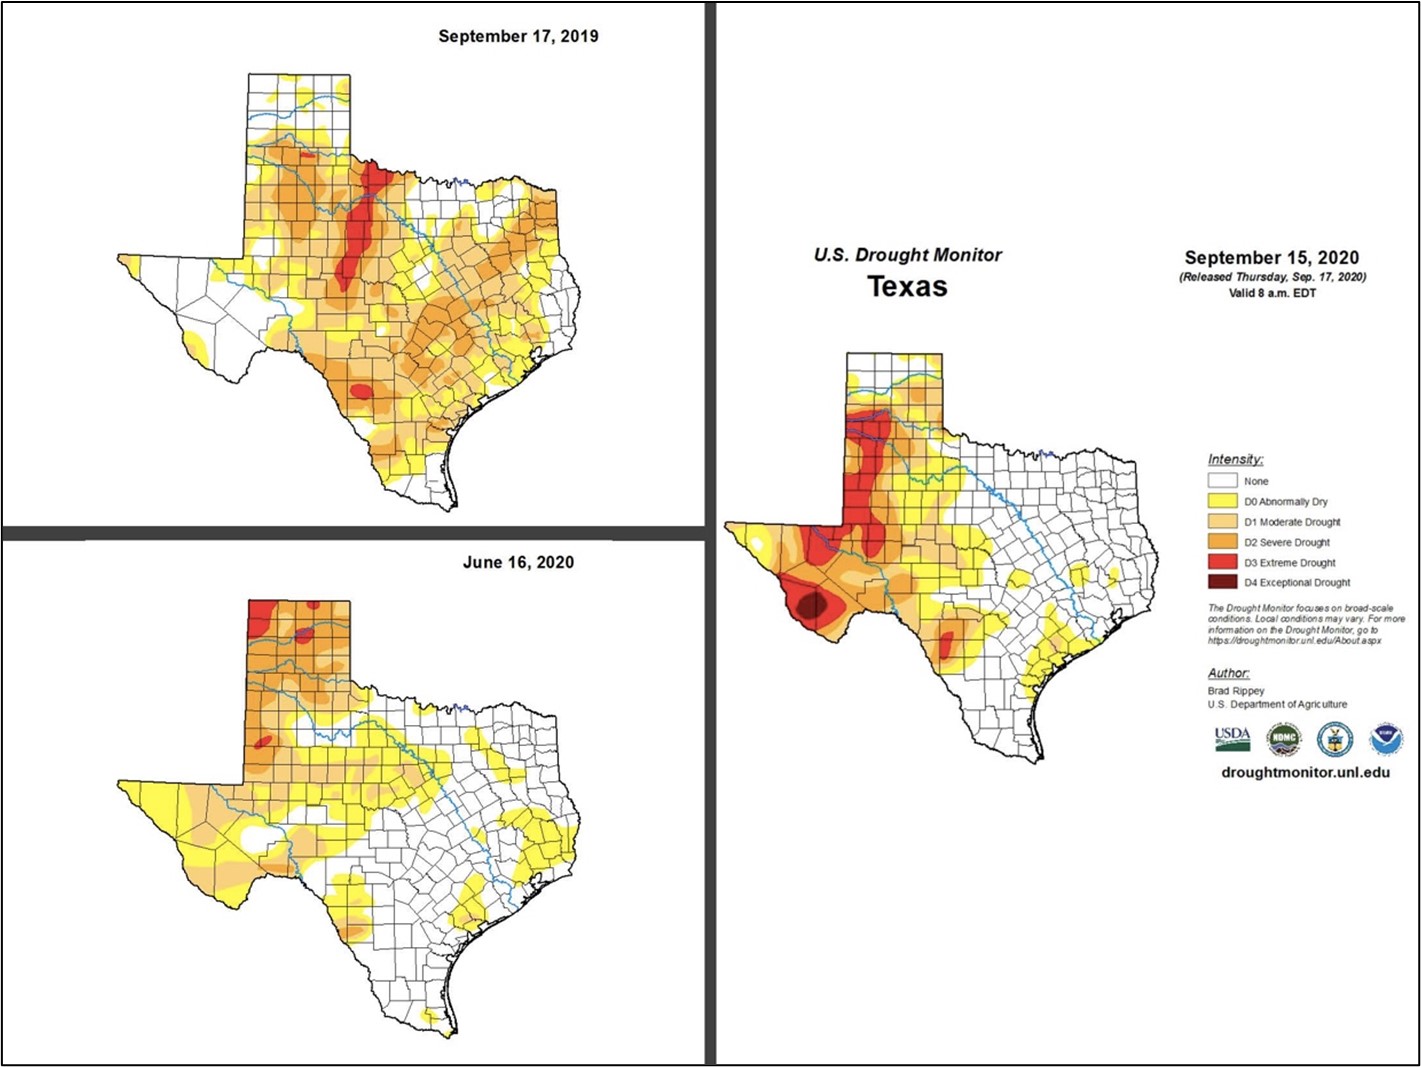
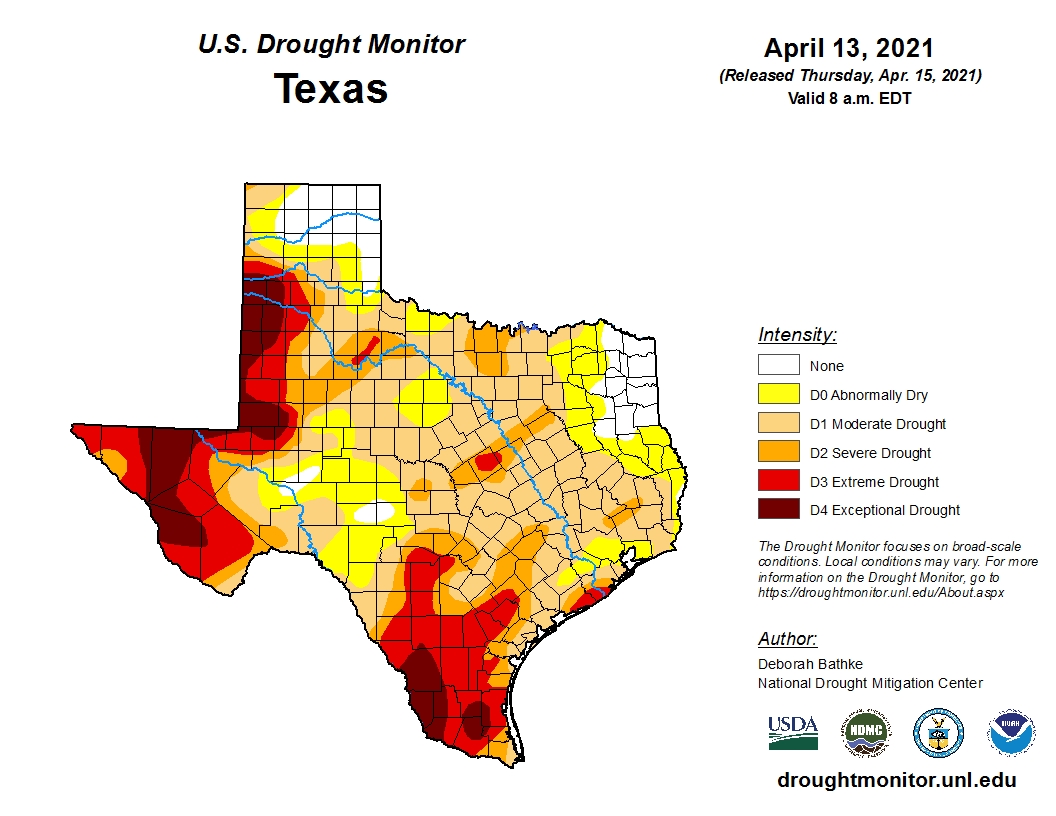
Drought in Texas
Texas has been prone to drought conditions before and will continue to experience them well into the future. Current and past drought maps can be found on the following website to share with your students as you discuss this matter and can help with this module https://droughtmonitor.unl.edu/.
The following maps show the drought monitor at different time periods:
- September 17, 2019
- June 16, 2020
- Septmeber 15, 2020
- April 13, 2021
100th Meridian
In April 1877, John Wesley Powell, geologist, scientist and explorer of the American West, met with a group of eminent scientists at a gathering of the National Academy of Sciences, and literally, drew a line on a map at the 100th Meridian. The “line in the sand,” so to speak, bisected the continental United States, revealing a distinct demarcation between a semi-arid climate in the west and a humid continental and humid subtropical climate in the east (Ross 20195). In his 1878 Report on the Lands of the Arid Regions of the United States6, a compilation of information from his expeditions, Powell wrote that the arid West was not suitable for agricultural development, except for about 2% of the lands that were near water sources (Worster 20117).
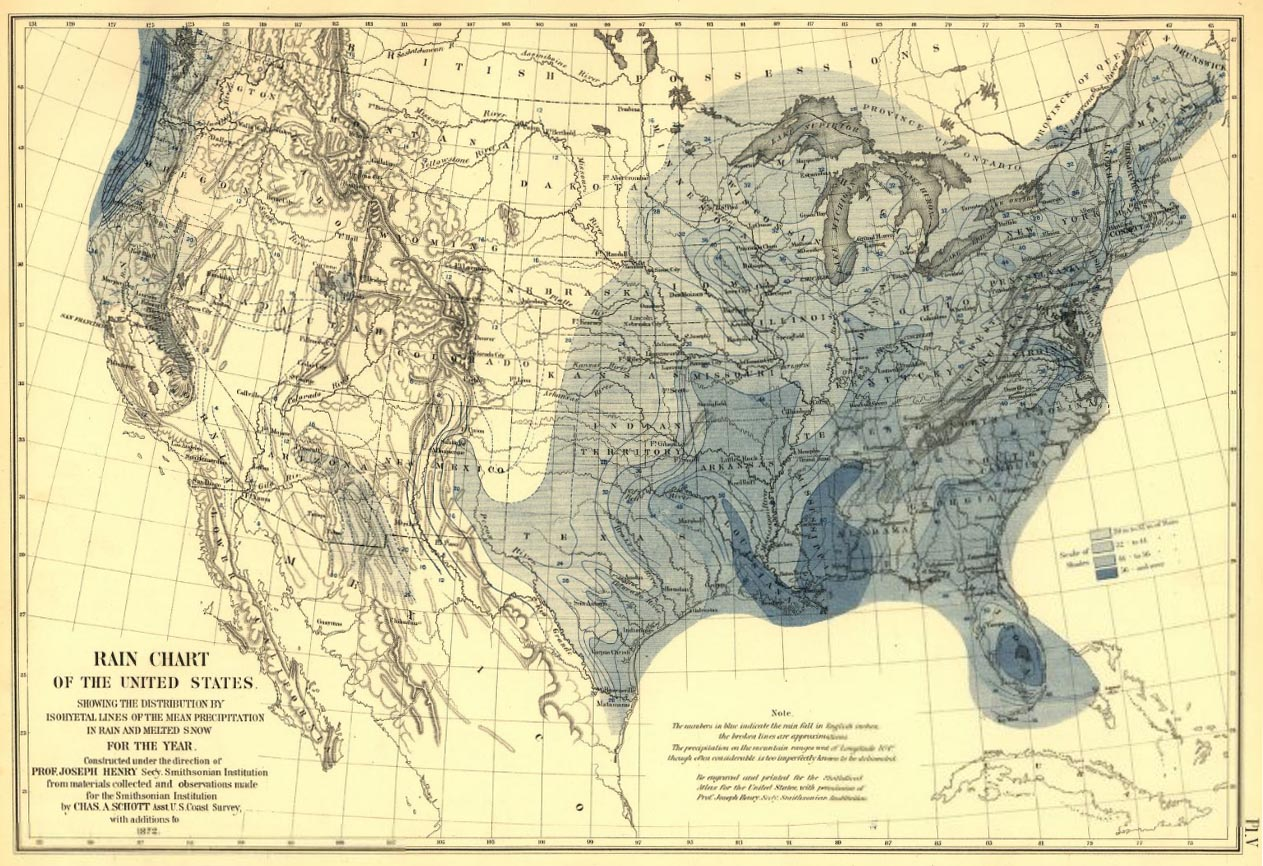
Rain chart of the United States, 1872.8
The 100th Meridian extends from pole to pole and, in the Western Hemisphere, extends from the North Pole across the Arctic Ocean, North America, the Pacific Ocean, the Southern Ocean, and Antarctica to the South Pole. In North America, the meridian runs through the Canadian provinces of Nanavut and Manitoba, then continues on through six state of the United States—North and South Dakota, Nebraska, Kansas, Oklahoma, Texas and through eastern Mexico (Great Plains Alliance 20119; Leifert 2018). One can traverse the 100th Meridian on U.S. 83 and 283 from the far reaches of Canada to Laredo, Texas.
Today, the 100th Meridian continues to serve as a climate boundary that roughly cuts about midway through the Great Plains. The line that Powell drew as dividing the arid and humid sections of the continent has become known as the “effective” 100th Meridian (Leifert 2018). It also denotes the beginning of steady increases in elevation, as it corresponds roughly to the 600-meter elevation contour as the land rises from the Great Plains toward the Great Rocky Mountains (Leifert 2018). The line also delineates population density, with greater density on the eastern side and lesser density west of the meridian (Seager et al. 201810).
The divide is created by three factors: 1) obstruction of orographic precipitation by the Rocky Mountains from the Pacific Ocean from reaching farther inland (i.e., the “Rain Shadow Effect”), 2) Atlantic winter storms bringing moisture to the eastern half of the U.S., and 3) moisture from the Gulf of Mexico moving north and curving eastward during the summer months (Seager et al. 2018).
In Texas, the Meridian cuts through 16 counties. In addition, the meridian claims five more counties at the Texas-Oklahoma border at the eastern Texas Panhandle (Howder 2013). The 100th Meridian first marked the boundary between the Republic of Texas and the vast Louisiana Purchase, as well as, in 1819, establishing part of the border dividing New Spain and the United States between the Red River and Arkansas River by the Adams-Onís Treaty. The significance of the 100th Meridian extends well-beyond historical records (Turk 202011).
Shift of the 100th Meridian
Today, the 100th meridian is still considered a climatic boundary line, however, according to recent research, the 51-centimeter rainfall line is gradually moving east due to climate change (Leifert 2018). Richard Seager, a climate scientist at Columbia University’s Lamont-Doherty Earth Observatory (LDEO), along with colleagues Mingfang Ting, Nathan Lis and Jamie Rose Feldman are studying if there really is such a divide, and, if so, how has it influenced human settlement (Seager et al. 2018).
To do this, Seager’s team first had to determine if the 100th meridian still aligns with the dry-humid boundary, or if this boundary had shifted away. By developing a standard measure called the aridity index to assess aridity across a geographic area, and using observational data from the North American Land Data Assimilation System. they were able to estimate potential evapotranspiration — the amount of water the atmosphere could potentially extract from the surface — from the land based on temperature, wind speed, solar radiation and relative humidity. The ratio of actual precipitation to potential evapotranspiration provides the aridity index. The researchers then calculated and plotted the aridity index across the U.S. from 1979 to 2016, and found that a sharp aridity gradient still exists, but that it’s now centered around the 98th meridian (Seager et al. 2018; Leifert 2018).
The implications of the discovery in the eastward shift in aridity will be most evident in the southern and central Plains, and less so in the north. Both farming and water management will be affected by these changes in coming decades. Traditionally, the Midwestern farm economy has reflected the east-west aridity gradient, that is, the density of farms is highest between the 90th and 100th meridians at all latitudes, and uniformly lower west of the 100th meridian, where far more extensive irrigation is used. Thus, as the aridity boundary, or the “effective 100th meridian,” moves east due to climate change, farms to the west of the shifting line will increase in size, especially in the south. That is because, in arid areas, farms must be larger to be profitable. For instance, The Dust Bowl droughts of the 1930s led to larger farms amid the Great Plains for that reason (Seager et al. 2018; Dockrill 201812).
In Texas, the line includes the fastest-growing part of the state: the Austin-Round Rock metro area, whose population is projected to rapidly increase by 83 percent to 3.78 million by 2046. This will place upward pressure on water supplies that will likely be less available in the city’s warmer, drier future. In addition, reservoirs in Central Texas that had been reliably replenished at the end of a drought will start to see circumstances where the drought is over but the reservoir still isn’t full. At that point, central Texas will reach a permanent state of reduced water availability (Collins 201813). Just east of the 100th meridian lies a line of Texas’ largest and most rapidly growing urban areas, stretching from the Dallas-Fort Worth Metroplex to the Rio Grande Valley. It is along this corridor where the biggest changes in population, climate and land use are expected.