Project GO

Tornadoes

Lesson Plan Two: Finding Tornado Alley

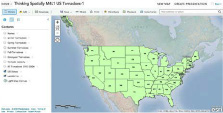
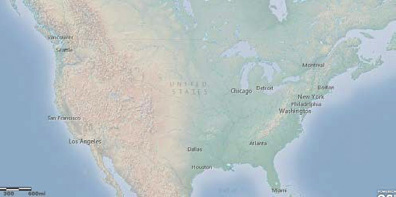
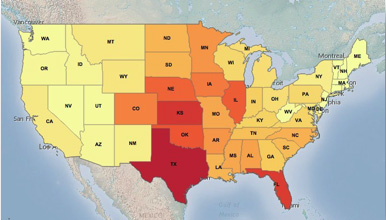
Overview: In this lesson, students will work with 10 years of tornado data for the entire United States to explore Tornado Alley. They will use three different approaches—frequency, intensity, and density—to identify Tornado Alley, the part of the country where most tornadoes occur. Finally, students will examine and compare seasonal differences in tornado occurrences.

This lesson is taken from the ESRI EdCommunity website Thinking Spatially Using GIS, a free online resource. This website offers several lessons for use in classrooms about a variety of topics.

Estimated Time: 120 minutes, split up among three class periods

Materials:
Student Activity: Finding Tornado Alley
Worksheet 1: Tornado Alley
Worksheet 2: Map of the 48 States
Optional Breakout Lesson: Map Scale and Measurement
Optional Breakout Lesson: Symbols and Map Features
Optional Breakout Lesson: Calculating Averages
Computer and internet access (for teacher and each student/or groups)

Learning Objectives: After completing the lesson, students will be able to:

  1. Identify and compare four regions in the United States based upon tornado activity
  2. Identify spatial patterns on different map layers of geographic data
  3. Identify temporal patterns on different map layers of geographic data
  4. Analyze and compare the frequency, intensity, and density of tornadoes and learn about the differences between them
  5. Compare the geographic extent of different layers of information

Vocabulary: N/A

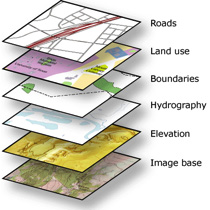
GIS Tools and Functions:

  • Open a map file on ArcGIS Online
  • Zoom to the geographic extent of a layer
  • Add a data layer to a map
  • Identify to get information about a feature
  • Use a filter to select features and records in a layer
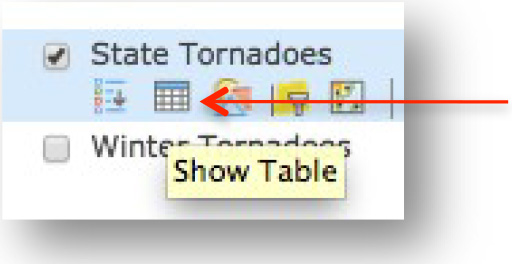
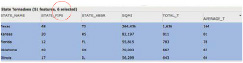
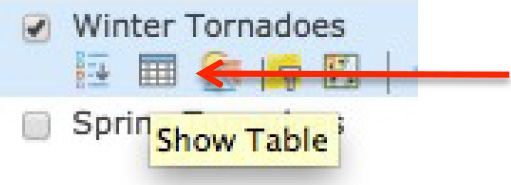
  • Open the attribute table for a layer
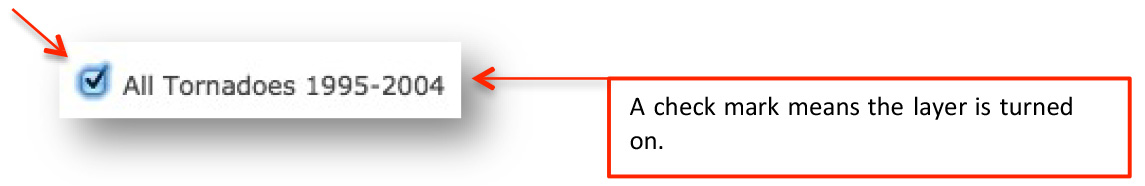
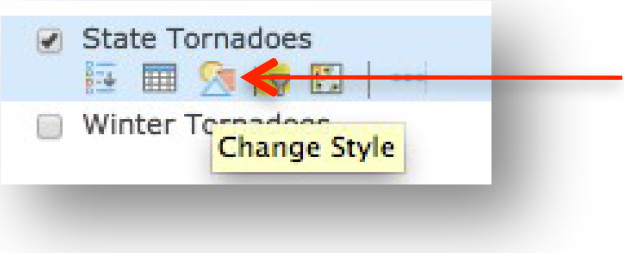
  • Turn layers on and off
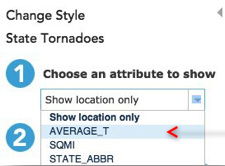
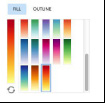
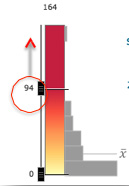
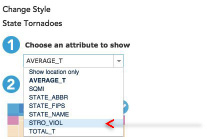
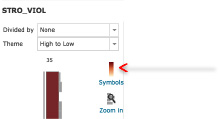
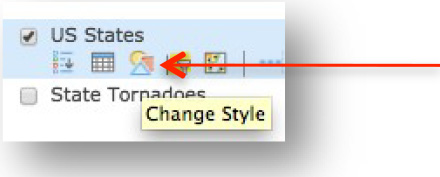
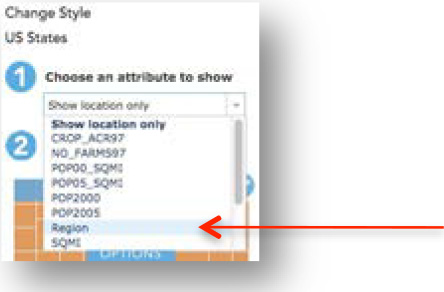
  • Change map style (legend)
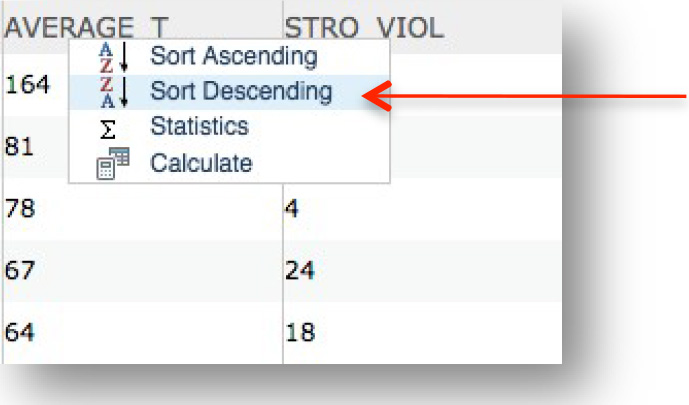
  • Sort fields in a table
  • Select records in a table
  • Create a graduated symbols style in the legend
  • Create a unique symbols style in the legend

Additional Resources:

Opening the lesson:

Begin this lesson by focusing on the following concepts.

  1. The United States is made up of landforms and physiographic regionsGEOGRAPHY: This lesson focuses on the physical geography of the US. Topography refers to all of the surface features of an area. Physiography is only the geologic surface or terrain features of an area, also known as landforms. Common landforms are mountains, hills, valleys, cliffs, and plains.US Landform Map
  2. Three different aspects of tornado occurrence: frequency, intensity, and densityThese 3 words have different definitions in different disciplines. For this lesson: Frequency means how often something repeats. Intensity means how strong or powerful something is. Density is the number of objects in a certain area, calculated by # of objects divided by the measurement of the area.
  3. AveragesMATH: The average is calculated by sum all the numbers divided by the total number in the list. Ex) Average of 2, 7 and 9? 2+7+9=18; 18/3=6. Avg. = 6 and how to calculate them
  4. Studying natural disasters can help you learn about weather, climate, landformsGEOGRAPHY: Look at a Climate map of the US. Discuss climates in terms of the type of weather patterns commonly associated in your area. Also compare weather patterns to the various landforms of the regions.US Climate Map, and other aspects of geography
  5. Patterns of features on maps have spatial and temporal*Spatial means the space on a map a feature encompasses, whereas temporal means the time during which the feature happens. Tornadoes have spatial patterns (how they move across the map) and a temporal pattern (the time of year they occur). patterns
  6. Tornado dynamics
  7. Weather patternsGEOGRAPHY: Seasons are produced by the Earth-Sun relationship.4 http://www.timeanddate.com/astronomy/seasons-causes.html Weather patterns are produced by the atmospheric pressure surrounding the Earth.Weather Patterns change by season and by year

Next indicate to students that Tornado Alley is an area of the United States that has more tornadoes than any other place on Earth. Many people argue about which states are in Tornado Alley. In this lesson, you will learn how to find this area for yourself! By the time you finish this lesson, you will be able to list the states that have the most frequent tornadoes, the strongest tornadoes, and the greatest concentration of tornadoes. You will be able to identify states that are in Tornado Alley.

Go on to say that tornadoes are associated with certain weather patterns, and these patterns change with the seasons. In this lesson, you will learn which regions of the United States have tornadoes at different times of the year—winter, spring, summer, and fall.

Let’s explore Tornado AlleyIf this is the first time your students are using GIS, this lesson should be conducted as a teacher-led activity with students following along. Lead students through the steps and ask them the questions as a class. Make sure each student answers the questions on their sheet because they will hand it in. Ideally, students will have access to their own computers, but if not, students can complete the activities in groups. It is best to go through Tasks 1 - 5 as a class, modeling how to use the technology as students become familiar with ArcGIS Online. Then have students work independently on the remaining tasks..”

Developing the Lesson:Make sure that you run through this lesson before you teach it in the class, or before the students do it on their own. This will help you determine if the lesson should be completed as a teacher-led lesson or as individual work sessions.

    Task 1: Open the map

  1. Distribute a copy of Student Activity: Finding Tornado Alley to each student. Indicate that students will use this handout as a guide throughout this lesson, as they work with the ArcGIS online maps. It is identical in content to the lesson plan that follows. Also distribute copies of the Tornado Alley and the Map of the 48 States worksheets to each student.
    1. Launch an Internet browser.
    2. Go to this link: http://arcg.is/1K6fM56

    A map document has been created for you to use in this exercise. When the map document opens, you see a map of the United States. The ArcGIS Online Map Viewer title is in the top left corner of the window.

    Map of United States

    A map of the 48 states labeled with their abbreviations appears on your screen. On the left side of the map, you will see a column containing three buttons: About this map, Contents, and Legend.

    Click on “Contents”. A list of layersOne way to help students visualize layers is by preparing a hands-on demonstration. Get a local street map as your basemap. Then on top of that place a transparency paper with data (travel route from home to school). Then place another transparency over that with different data (locations of fast food restaurants). Explain to the students that each transparency is a layer with different data on it all within the same map area. And when you overlay it on a basemap you can spatially see the data. appears. Layers are used to show geographic data on a GIS map. Each layer has a name and a legend. You can turn layers on and offWhen you turn layers on and off this is also known as Overlay. For example in the image on the left, the Elevation layer is overlayed on the Image base. The bottom layer, is also called the basemap. This provides the visual context of the map, usually a topographic map or imagery map.

    How layers work on a GIS map.
    GIS Map Layers
    (http://docs.mangomap.com/ knowledge_base/topics/why- is-my-map-slow-to-load)
    . At the top of the map, you see menus and buttons that you will use during this activity.

  1. Look at the ArcGIS Online map window and observe the following:
    • On the right side you see a map.
    • On the left side you see a column that displays the legend for the map.
    • In the top right corner you will see a “Modify Map” link.
  2. Click on the Modify Map link in the top right corner of the map view.
  3. Look at the top of the ArcGIS Online map viewer window and notice the different buttons. You will use some of these buttons as your progress through this lesson.
  4. Buttons

    Task 2: Enlarge the ArcGIS Online window

    If the ArcGIS Online Map Viewer window is small when the map document first opens, you may wish to enlarge it.

  5. In the upper right corner (PC) or upper left corner (Mac) of your ArcGIS Online window there are three buttons. Click the middle button (PC) or the right green button (Mac).

    PC/Map Buttons

    Now the ArcGIS Online Map Viewer window fills your whole screen.

    You can also change the size of your ArcGIS Online window by stretching it. Stretching the window instead of maximizing it allows you to organize other windows and dialog boxes as they appear.

  6. Place the cursor on any corner of the ArcGIS Online window that is not at the edge of your screen. The cursor changes to a diagonal double-headed arrow. Click and drag the window outward until the ArcGIS Online window fills about two-thirds of the screen. Let go of the mouse button.
  7. Task 3: Tornadoes of the United States

  8. Hover over and click on Show Contents of Map button.

    Show Contents Map Button

    In ArcGIS Online Map Viewer, a map is made up of layers.

  9. Look at the Contents area on the left of the map and observe the following:
    • There are thirteen layers: Names, US States–Outlines, State Tornadoes, Winter Tornadoes, Spring Tornadoes, Summer Tornadoes, Fall Tornadoes, Strongest Tornadoes, Tornado Density, US States, All Tornadoes 1995-2004, Landforms, and Light Gray Canvas basemap.
    • Each layer except the last layer (the Light Gray Canvas basemap) has a small box in front of it.
    • The boxes for US States, US States – Outlines, and Landforms are checked.
    • The other boxes in front of the layers are unchecked.

    Next, you will learn how to turn layers on and off.
  10. Turn off the US States layer by clicking the box next to the layer name.
  11. Turn Off State Layer

  12. Turn on the All Tornadoes 1995-2004 layer by clicking the box next to the layer name. Each dot represents a tornado that occurred from 1995-2004 (a period of 10 years).

    Turn On All Tornadoes 1995-2004

    This is called turning a layer on and offMake sure to note that the All Tornadoes 1995-2014 layer is now overlayed on the basemap..

    Q1: Look at your map. In what part of the country do most tornadoes occur? (Circle the correct answer.)

    1. Eastern states
    2. Western states
    3. Central and eastern states

    Q2: Do you see any states that don’t have tornadoes?

    1. Yes
    2. No
  1. Zoom out*When you zoom out on a map to see a greater area this is called a small-scale map. When you zoom in on a map to a smaller area this is called a large-scale map. Take note of the scale in the bottom left of the map to see how the scale changes when you zoom in and out.

    An optional breakout MATH lesson is included here to discuss scale and measurement. For Part 1, you will need a map of the state you live in with an accurate scale (one for each student and a transparency to demonstrate) and a ruler. A map of Texas is included as an example. Refer to http://illuminations.nctm.org/lesson.aspx?i d=1675 for directions on the lesson. Part 2 of the lesson discusses the difference between large scale and small scale maps.
    of the map until all 50 states are in view.

    Q3: Do you see any states now that don’t have tornadoes?

    1. Yes
    2. No
  2. Zoom back in to the 48 states. Tornadoes are more common in some parts of the country than others. Let’s look at a different view of the United States.
  3. Turn off the US States—Outlines layer by clicking the check mark next to the layer name.
  4. US States-Outlines Layer

  5. Turn off the All Tornadoes 1995-2004 layer.

    All Tornadoes 1995-2004

    You are now looking at an image of the United States showing high areas (mountains) and low areas (plains and valleys). This is called a Physical MapGEOGRAPHY: A physical map shows landforms and elevations of an area. Ask students: What color are the highest elevations? (reddish brown) What color are plains represented by? (green) of the United States.

    Physical Map of the US

  6. Turn on the Names layer by clicking the box next to the layer name.

    Names Layer

    Now you see the names of some of the landforms of the United States.

  7. Turn on the All Tornadoes 1995-2004 layer again.

    Turn On All Tornadoes 1995-2004

    Q4: Look at your map. In what part of the country do most tornadoes occur?

    1. Rocky Mountains
    2. Great Plains
    3. Appalachian Mountains

    The Great Plains has lots of thunderstorms, creating the kind of weather conditions that can cause tornadoes. Thunderstorms occur when warm, moist air meets cool, dry air.

  1. Turn on the US States—Outlines layer

    US States-Outlines Layer

    Warm, moist air that feeds these thunderstorms comes from the body of water south of the Great Plains.

    Q5: Look at your map. What is the name of this body of water?

    Cool, dry air comes from the land to the north of the Great Plains.

    Q6: Look at your map. What is the name of this country?

  1. Turn off the Names layer.
  2. Turn off the All Tornadoes 1995-2004 layer.

    Task 4:Before moving on be sure to debrief about everything covered up until this point. This is important so the students can synthesize and reflect on the information and knowledge learned. This can also be a natural breaking point in the lesson. States where tornadoes occur most often

    While Tornado Alley is generally in the middle of the country, many people argue about the specific states that belong in this area. There are three different ways, or methods, to decide which states are in Tornado Alley:

    1. States where tornadoes occur most often (frequency)
    2. States where the most dangerous tornadoes occur (intensity)
    3. States where the greatest concentration of tornadoes occurs (density)

    You will use GIS to analyze these three methods and decide on some of the states that are in Tornado Alley. You will start by finding out where tornadoes occur most oftenMATH: This means where tornadoes most frequently occur. To do this we will be looking at the AVERAGE number of tornadoes in an area..

  3. Turn on the State Tornadoes layer.

    The State Tornadoes layer contains information about the tornadoes for each state. You will change its symbolsSymbols/Symbology is a way to represent a feature on a map. A characteristic of a map feature may influence the size, color, and shape of the symbol used. Features are shown as a point (hospital), line (roads) or polygons (park).

    An optional breakout lesson is available to examine the differences in symbols and features.
    .

  4. Hover over the State Tornadoes layer and click on Change Style.

    State Tornadoes Layer Change Style

  5. Click on the down arrow next to Choose an attribute to show and select AVERAGE_T.

    US States-Outlines Layer

  6. Click on the Counts and Amounts (Color) SELECT box and click on OPTIONS.

    Counts and Amounts Select Box

  7. Click on Symbols.

    Symbols

  8. Choose the Red to Yellow color rampWhen displaying data you want to choose the best way to display it and makes the most sense.

    This creates a graduated color map, where the range of colors indicates a progression of numeric valued. Therefore, 0 is represented by yellow and 94, the highest number on the legend, is red. This also keeps from grouping the data into specific classes.
    .

    Red to Yellow Color Ramp

  9. Click Ok.
  10. Drag the slider to the left of the color ramp to 94.

    US States-Outlines Layer

  11. Instead of a gradual color change, you can also classify the data into groups, which you can explore with the students. This changes the pattern of the data shown. Click Classify Data and then click between the different ways: Natural Breaks, Equal Interval, Quantile, Standard Deviation, and Manual Breaks. Notice how the map changes with each one. Change the number of breaks and see how it changes the picture.Click Ok.
  12. Click Done.

    You see a mapGEOGRAPHY: The map created is a graduated color map. The range of colors indicates a progression of numeric value. The Red to Yellow color ramp depicts that RED has the most average number of tornadoes a year and the YELLOW has fewer average number of tornadoes a year. showing the average number of tornadoes per year in each state (from 1995 to 2004). The red color means there were a lot of tornadoes; the yellow means there were relatively few tornadoes

    US States-Outlines Layer

    Q7: Look at your map and at the legend. In which state did tornadoes occur most often?

      What does “average number of tornadoes per year” mean?MATH: This is a great way to include some math into the lesson. Use the optional breakout lesson on averages here.

      Suppose a state had 200 tornadoes from 1995 to 2004 (a period of 10 years). If you divide the total number of tornadoes (200) by the number of years (10), you will get the average number of tornadoes per year:

      200 ÷ 10 = 20 tornadoes per year

  1. Hover over the State Tornadoes layer and click on the Show TableStudents should be familiar with making tables and Microsoft Excel. Explain to them that an attribute table is the same thing you would produce in Excel

    Building your own excel sheet with data is also the easiest way to upload data into ArcGIS Online to create your own maps.
    button.

    State Tornadoes Layer Show Table

  2. Click on the field name AVERAGE_T and choose Sort Descending. The states are listedCompare the averages you got on the breakout lesson, to the averages in the attribute table in order from the highest number to the lowest number of tornadoes.

    Sort Descending

    Let’s look at the top six states.

  3. Hold down your Shift keyStudents may have a hard time with this. Walk around and help them. on the keyboard, and slowly click the first six records in the table (count them). They become highlighted in blue. They also become highlighted on your map. You may need to scroll down to see the sixth record in the table or drag your map up slightly to see all of the six states highlighted on your map.

    6 States Table

    Note: If you make a mistake, click the first record without holding down the CTRL key. Then hold down the CTRL key and click the next five records.

  4. Look in the table for the STATE_NAME field. You see the names of six states highlighted in blue.
  5. Take out the Tornado Alley worksheet that your teacher gave you.
  6. Find Column 1: Highest average number of tornadoes.

    Q8: Write the names of these six states in Column 1 of your worksheet. (Some state names are filled in for you.)

  1. Close the table of attributes.

    Task 5:Walk the students through this task up to Step 57. After that, they should be able to complete the rest of the lesson on their own. Continue to walk around the class and make sure students are on task. Help them when necessary. State where the strongest tornadoes happen.

    Another way to decide which states are in Tornado Alley is to see where the strongest tornadoes happen. The strength of a tornado is measured by the speed of its winds and by how much damage it causes.Before moving on be sure to debrief about everything covered up until this point. This is important so the students can synthesize and reflect on the information and knowledge learned. This can also be a natural breaking point in the lesson.

    Ask students: What scale is used to measure tornado strength. (Fujita Scale or Enhanced Fujita Scale). How many categories are there in the scale and what is the worst? (5 and 5)
    You will look at which states had the strongest tornadoes between 1995 and 2004.

  2. Turn off the State Tornadoes layer.

    State Tornadoes Checkbox

  3. Turn on the Strongest Tornadoes layer.

    Strongest Tornadoes Checkbox

    Each purple dot represents a single tornadoThe dot is an example of a point feature.. These tornadoes had winds that were stronger than 150 miles per hour and caused a lot of damage. Only a small portion of all tornadoes are really strong.

    Q9: Look at the map. List two states that you think have a high number of strong tornadoes.

    Now you will find out if you were right.

  1. Turn off Strongest Tornadoes.
  2. Turn on State Tornadoes.
  3. Hover over the State Tornadoes layer and click on the Change Style button.

    State Tornadoes Layer Change Style

  4. Click on the down arrow next to Choose an attribute to show and selectNotice how we are using the same data set but instead of analyzing the average number of tornadoes like we did in the last task, we are now analyzing the attribute strongest and violent tornadoes. This is possible because the attribute table includes all of this data. STRO_VIOL.

    STRO_VIOL Attribute Box

  5. Click on the Counts and Amounts (Color) SELECT box and then the OPTIONS box.

    Counts and Amounts Select Box

  6. Click on Symbols.

    STRO_VIOL Symbols

  7. Choose the Red to Yellow color ramp.

    US States-Outlines Layer

  8. Click OK.
  9. Drag the sliderLook at the distribution of the gray bars on the right of the color ramp. They are distributed along the ramp; therefore, the top of the legend is set at 32, between the top two bars. to the left of the color ramp to 32.

    Color Slider to 32

  10. Click OK.
  11. Click Done.

    The red color means more strong and violent tornadoes the yellow color means less.

    US Map with Dark Red States

  12. Click one of the dark red states.
  13. On the left side of the popup window you see the name of the fields on page 2 of the popup. On the right side you see the values.
  14. Look at the value for the STRO_VIOL field. It tells you the number of strong and violent tornadoes that occurred in that state from 1995 to 2004.

    Q10: What is the name of this state?

    Q11: How many strong and violent tornadoes did it have from 1995 to 2004?

  1. Click another dark red state on the map.

    Q12: What is the name of this state?

    Q13: How many strong and violent tornadoes did it have from 1995 to 2004?

  2. Close the popup window.
  3. Hover over the State Tornadoes layer and click on the Show Table button.

    State Tornadoes Layer Show Table

  4. Click on the field name STRO_VIOL and choose Sort Descending.

    STRO-VIOL Sort Descending

    The states are now listed in order from the highest number of strong and violent tornadoes to the lowest number.

    Let’s look at the top six states.

  5. Hold down your Shift key on the keyboard, and slowly click the first six records in the table (count them). They become highlighted in blue. They also become highlighted on your map. You may need to scroll down to see the sixth record in the table or drag your map up slightly to see all of the six states highlighted on your map.

    Table Results

  6. Let go of the Shift key.
  7. Look to the left in the table until you see STATE_NAME. You see the names of six states highlighted in blue.
  8. Take out the Tornado Alley worksheet.
  9. Find Column 2: Highest number of strong or violent tornadoes.

    Q14: Write the names of these six states in Column 2 of your worksheet. (Some state names are filled in for you.)

  1. Close the table of attributes.

    Task 6: States with the highest concentration of tornadoes.

    Looking at tornado density is a third way to decide which states are in Tornado Alley. This shows where the most tornadoes occurred within the smallest area of land (closest together). When you map how close together or far apart tornadoes are, you call this a tornado “density” mapGEOGRAPHY: Ask you students if they can name another common density map. (Population density).

  2. Turn off State Tornadoes.

    State Tornadoes Checkbox

  3. Turn on the Tornado Density layer and the US States – Outlines layer.

    Tornado Density Layer

    The dark red areas show where tornadoes are most dense (close together). The light red (pink) areas show where tornadoes are least dense (spaced far apart).

  4. Look at the map. The highlighted areas are where tornadoes are most dense (close together).
  5. Take out the Tornado Alley worksheet.
  6. Find Column 3: Highest tornado density.

    Q15: Write the names of the states that have the most dense tornadoes in Column 3 of your “Tornado Alley” worksheet. (If you have turned off your US States–Outlines layer, turn it on to see the state name abbreviations.)

    Q16: How many states contain dense tornado areas?

  1. Turn off the Tornado Density layer.

    You have defined Tornado Alley in three different ways:

    1. States where tornadoes occur most often.
    2. States where the strongest tornadoes occur
    3. States where tornado density is highest

    You listed these states on your Tornado Alley worksheet in Columns 1, 2, and 3.

  2. Look at Columns 1, 2, and 3 now.

    Q17: Which states appear in all three lists? Write the names of these states at the bottom of your “Tornado Alley” worksheet under “States in Tornado Alley.” (Two state names have already been filled in for you.)

  1. Take out your Map of the 48 States worksheet.
  2. Color in these six states on the map.

    Over 10 years, from 1995 to 2004, these states have been in Tornado Alley no matter what method you use to define this area.

    Task 7:Before moving on be sure to debrief about everything covered up until this point. This is important so the students can synthesize and reflect on the information and knowledge learned. This can also be a natural breaking point in the lesson. Where tornadoes occur during the seasons.

    You have seen how tornadoes can occur close together over landGEOGRAPHY: In other words, we have seen tornadoes spatially.. They can also occur close together over time. In this step you will look at where tornadoes occur during each season of the yearGEOGRAPHY: Now we will be looking at tornadoes spatially and temporally and in each region of the United States.

  3. Turn on the US States layer.
  4. Hover over the US States layer and choose Change Style.

    US States Layer Change Style

  5. Click on the down arrow next to Choose an attribute to show and select REGION.

    Choose an Attribute to Show Region

  6. Click on the Types (Unique symbols) Options box.

    Types (Unique Symbols)

  7. Click on OK to accept the automatic style change.
  8. Click Done.

    You see four United States regionsGEOGRAPHY: The four regions are identified as West (blue), Midwest (green), South (red) and Northeast (purple)., each with a different color, and you can see the state outlines.

    Four United States Regions Map

  9. Turn on the Winter Tornadoes layer.
  10. Winter tornadoes from 1995 to 2004 appear as green dotsThese green dots are point features. on the map.

    Q18: Look at the map. In what region of the country are most winter tornadoes? Hint: Look at the States legend to see the names and colors of the regions.

    1. Midwest
    2. Northeast
    3. South
    4. West
  1. Hover over the Winter Tornadoes layer and click on the Show Table button.

    Winter Tornadoes Show Table

  2. Look at the top title bar to see how many records (features) are in the table.

    Q19: How many tornadoes occurred in winter between 1995 and 2004?

  1. Close the table of attributes.
  2. Turn off the Winter Tornadoes layer.
  3. Turn on the Spring Tornadoes layer. (If you receive a “Layer did not draw completely” message, click on OK.

    Spring tornadoes from 1995 to 2004 appear as red dots on the map.

    Q20: In what regions of the country are most spring tornadoes?

    1. Midwest
    2. Northeast
    3. South
    4. West
  1. Hover on the Spring Tornadoes layer and click on the Show Table button

    Spring Tornadoes Show Table

  2. Look at the top title bar to see how many records (features) are in the table.

    Q21: How many tornadoes occurred in spring between 1995 and 2004?

  1. Close the table of attributes.

    Q22: Look at the map. List two differences between winter tornadoes and spring tornadoes. (Hint: You can turn both layers on at the same time or turn them on and off to compare them.When students turn on and off the layers make sure they are thinking about the underlying geography concepts. For example, are they looking for spatial patterns? Are the looking for relationships between features and layers? Are they relating temporal patterns to what they know about season of the year?)

  2. Turn off the Spring Tornadoes layer.
  3. Turn on the Summer Tornadoes layer.

    Summer tornadoes from 1995 to 2004 appear as yellow dots on the map.

    Q23: In what region of the country are most summer tornadoes?

    1. Midwest
    2. Northeast
    3. South
    4. West

    Q24: Look at the map. List one difference between summer tornadoes and spring tornadoes. (Hint: You can turn both layers on at the same time or turn them on and off to compare them.)

  4. Hover on the Summer Tornadoes layer and click on the Show Table button.

    Summer Tornadoes Show Table

    Look at the top title bar to see how many records (features) are in the table.

    Q25: How many tornadoes occurred in summer between 1995 and 2004?

  1. Close the table of attributes.
  2. Turn off the Summer Tornadoes layer.
  3. Turn on the Fall Tornadoes layer.

    Fall tornadoes from 1995 to 2004 appear as blue dots on the map

    Q26: In what region of the country are most fall tornadoes?

    1. Midwest
    2. Northeast
    3. South
    4. West
  1. Hover on the Fall Tornadoes layer and click on the Show Table button.

    Fall Tornadoes Show Table

    Look at the top title bar to see how many records (features) are in the table.

    Q27: How many tornadoes occurred in fall between 1995 and 2004?

    Q28: Which season had the most tornadoes?

    1. Winter
    2. Spring
    3. Summer
    4. Fall

    Q29: What is the peak season for the southern states (the season when the South has the most tornadoes)?

    1. Winter
    2. Spring
    3. Summer
    4. Fall

    Q30: What is the peak season for the northern states (the season when they have the most tornadoes)?

    1. Winter
    2. Spring
    3. Summer
    4. Fall

    Q31: Discuss with your classmates some possible reasons that the locations of tornadoes change with the season. Write down two possible reasons.

    Task 8: Exit ArcGIS Online.

  1. Close the ArcGIS Online browser tab.

Concluding the Lesson: Engage students in a discussion about the observations and discoveries they made during their exploration of US tornadoes and Tornado Alley.

“People who live in Tornado Alley are aware of the dangers of tornadoes and understand that they are part of life.

“GIS can help researchers and scientists map patterns that show where tornadoes touch down and study how tornadoes behave on the ground, including how far and fast they move and how wide an area they cover. Their research leads to better warning systems and better methods for predicting when a tornado might occur. These improvements make it safer for people who live in Tornado Alley.”

Have students turn in their Student Activity: Finding Tornado Alley and Map of the 48 States worksheet to be graded.

Extension of the lesson: Give each student three copies of the Map of the 48 states. Have students color each map according to the three columns from the Tornado Alley worksheet: frequency, intensity, density. Students should title each map correctly. After the maps are colored, have students compare the maps and discuss differences among the three.

Then, have students compare their map of tornado frequency to this map of Tornado frequency from 1950–1995. Are there similarities? Differences?

http://www.britannica.com/science/tornado/images-videos

Lesson Plan One: What do you know about Tornadoes?